1. Biofuels in the Global Energy Mix
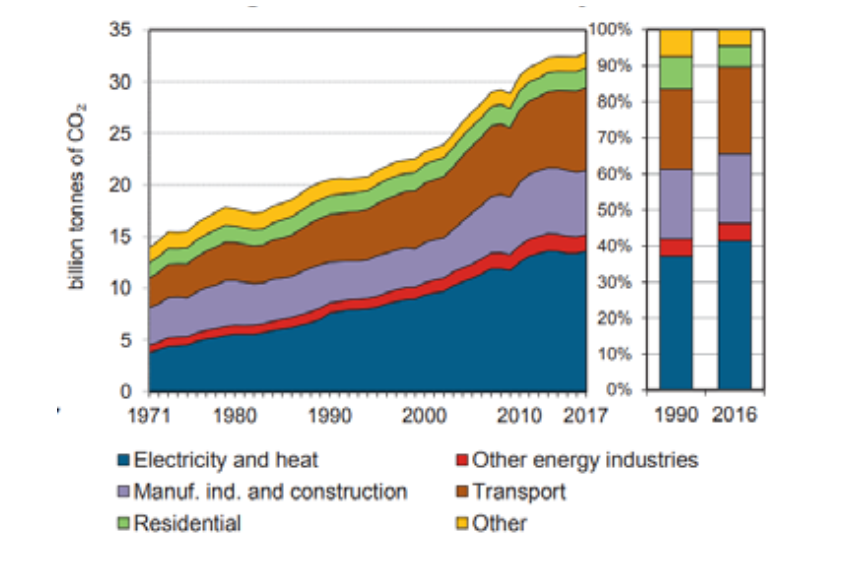
Transport accounted for almost 30% of global final energy demand and roughly 25% of global energy-related CO2 emissions in 2017. Emissions from transport increased by 2% annually at the global level in the period 2000- 2017, reaching 8 Gt CO2 (Figure 1.1).[1] Road transport, mostly for passenger travel, accounted for three quarter of total transport emissions and it is the mode that increased the most in absolute terms (+ 1.7 GtCO2), while international aviation led in terms of rate of growth (3% versus 2% of road transport).[2] Transport is the least diversified energy end-use sector: it consumes about two thirds of global oil final energy demand -- with more than 90% of the final energy demand consisting of oil products --, which suggests a significant challenge for deep decarbonization.[3]
FIGURE 1.1 Global CO2 Emissions by Sector, in Gt CO2 (IEA, CO2 emissions from fuel combustion).
Biofuels are the only renewable energy source used directly in the transport sector. They have the potential to leapfrog traditional barriers to enter the market as they are liquid (or gaseous) fuels compatible with current engines and blendable with current fuels. Ethanol, for example, is easily blended up to at least 10% with modern conventional gasoline vehicles, and to much higher levels in vehicles that have been modified to accommodate it. Biodiesel can be blended with petroleum diesel fuel in any ratio up to 100% for operation in conventional diesel engines. Further, biofuels share the long-established distribution infrastructure with little modification of equipment.[4]
In most countries embarking on biofuels initiatives, the recognition of non-market benefits is often the driving force behind efforts to increase their use, especially with respect to climate change. Some studies suggest that biofuels can provide significant reductions in greenhouse gas (GHG) emissions when compared to fossil fuels on a life cycle basis (see chapter 3.8 for details). This can be particularly relevant for hard-to-abate sectors, such as aviation, heavy-duty transport, and shipping. Even though a wide range of estimates exists, particularly large reductions are estimated for ethanol from sugarcane and from cellulosic feedstocks, as well as other waste- derived biofuels. Further, bioenergy can be combined with carbon capture and sequestration (BECCS) to help not only with emissions mitigation, but also promote the removal of CO2 from the atmosphere.
Biofuels can also provide air quality benefits when used either as pure, unblended fuels or, more commonly, when blended with petroleum fuels. The benefits include lower emissions of carbon monoxide (CO), sulphur dioxide (SO2) and particulate matter (particularly when emissions control systems are poor, such as in some developing countries), although biofuels can increase some emissions categories, such as evaporative hydrocarbon emissions and aldehyde emissions from the use of ethanol. Usually, biofuels are also less toxic than conventional petroleum fuels and, in some cases, they can reduce wastes through recycling.[5]
As for vehicle performance, ethanol has a very high octane number and can be used to increase the octane of gasoline, either directly blended with gasoline or previously converted to ethyl-tertiary-butylether (ETBE) before blending. Biodiesel, in turn, can improve diesel lubricity and raise the cetane number, aiding fuel performance.[6]
Furthermore, the production of crop-based biofuels provides an additional product market for farmers and brings economic benefits to rural communities. But the production of biofuels can also draw crops away from other uses (such as food production) and increase their price. For specific circumstances, this may translate into higher prices for consumers and lead to an undesired competition with food supply. However, when well-planned and carefully implemented to avoid environmental and social risks, biofuels can generate benefits and contribute to many policy objectives, as well as to strategic demands from society and the economy.[7]
Biofuels' Share in Global Energy Mix
In 2018 3.7% of transport fuel demand was by renewables, corresponding to around 4 exajoules (EJ). Biofuels provided 93% of all renewable energy, the remains coming from renewable electricity (IEA, 2019). In the same year, they contributed around 90 Mtoe or almost 2 million barrels of oil equivalent (mboe) per day. In the early 2000s, biofuels were experiencing double-digit growth but after 2010 that growth slowed down due to economic and structural challenges, as well as policy uncertainty in key markets. As a result, production increased at a slower average annual growth rate of 4% over 2010-18.[8]
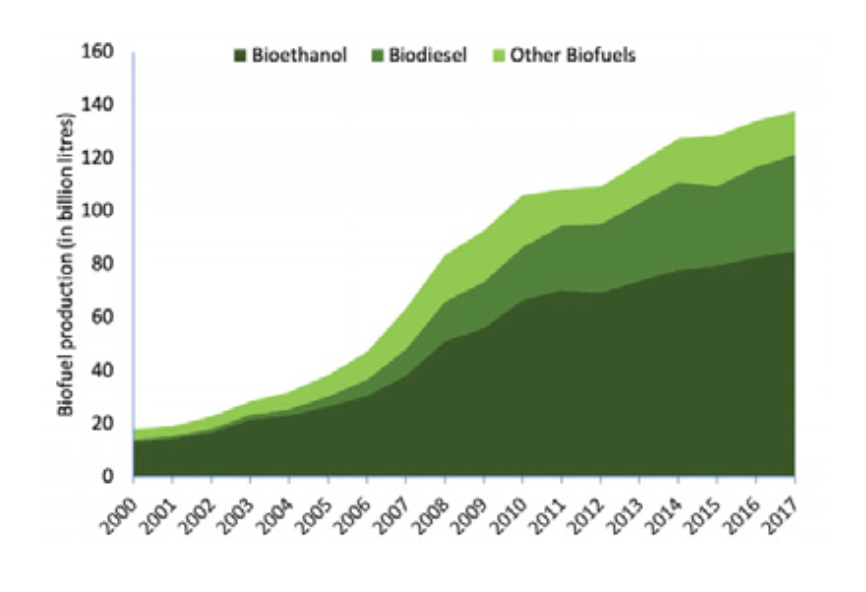
First generation bioethanol (i.e., produced from food crops) is still the major contributor to the global biofuel supply. The production of second and third generation biofuels from cellulosic plant tissues or algae is overall negligible (but is expected to be substantial in the coming 10-20 years according to the experts). Ethanol contributes to about 70% of the global biofuels production, followed by biodiesel (Figure 1.2).[9] Bioethanol is produced mostly with corn and sugarcane followed by wheat, sugarbeet and sorghum. Biodiesel produced with rapeseed oil accounts for more than half of the global production, followed by palm oil and soybean oil. Most of the global consumption of biodiesel takes place in OECD+EU27 countries. The greatest biodiesel consumers are France and Germany, followed by the United States and Italy. These countries rely mostly on rape-mustard seed oil (and, in smaller amounts, palm oil and soybean oil), as do most of the other OECD+EU27 countries. Different oil consumption patterns are found in Brazil, which strongly relies on soybean oil.
In the last few years progress has been made in biofuels applications for aviation, due to the enhanced policy support in the United States and Europe. Flights using biofuel blends have surpassed 200,000, and continuous biofuel supply is already available at six airports. Nevertheless, the 15 million liters produced in 2018 accounted for less than 0.01% of the aviation fuel demand. In the marine sector, the use of biofuels is under consideration in certain cases, but uptake remains low due to the current higher costs.[10]
FIGURE 1.2. Global Production of Liquid Biofuels (WBA, Global Bioenergy Statistics 2019).
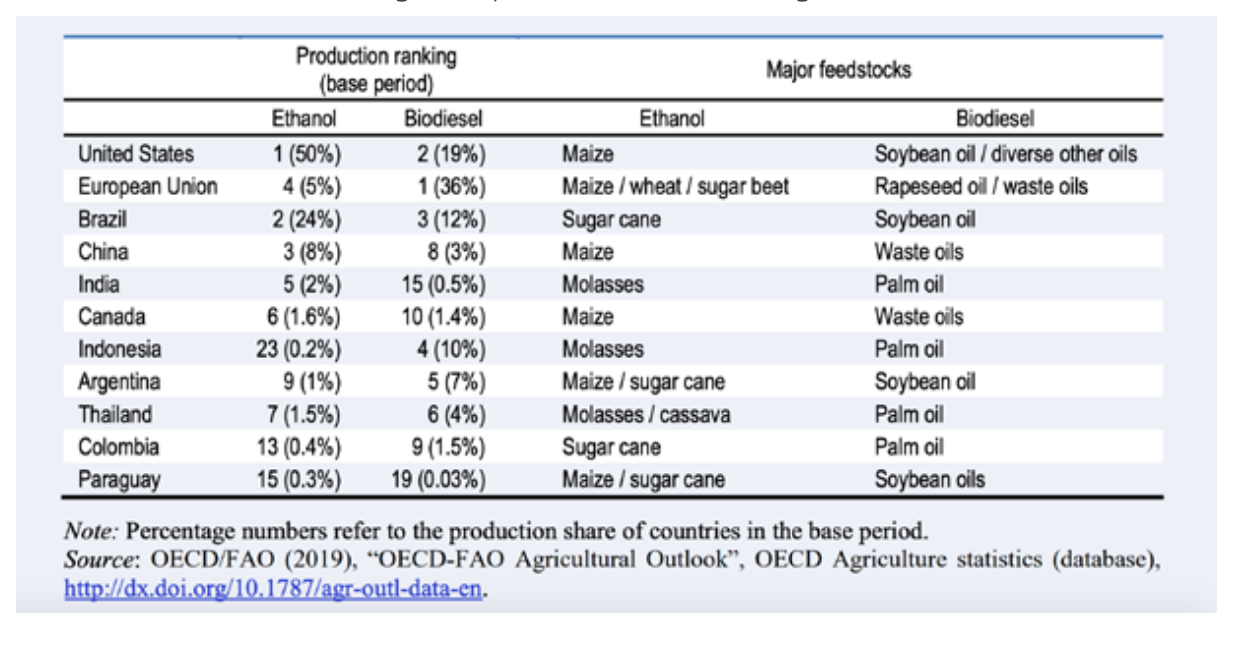
Transport biofuels play an important role in a limited number of markets. In 2016, just six countries had fuel ethanol production levels over 1 billion liters, in a global market dominated by the United States and Brazil, who jointly represented around 85% of the global production (Table 1.1).[11] Biodiesel production is more evenly distributed, with ten markets having production levels over 1 billion liters, contributing to a total of just under 36 billion liters of global production.[12]
TABLE 1.1. Biofuel Production Ranking and Key Feedstocks (OECD/FAO, Agricultural outlook 2019-2028).
International Trade
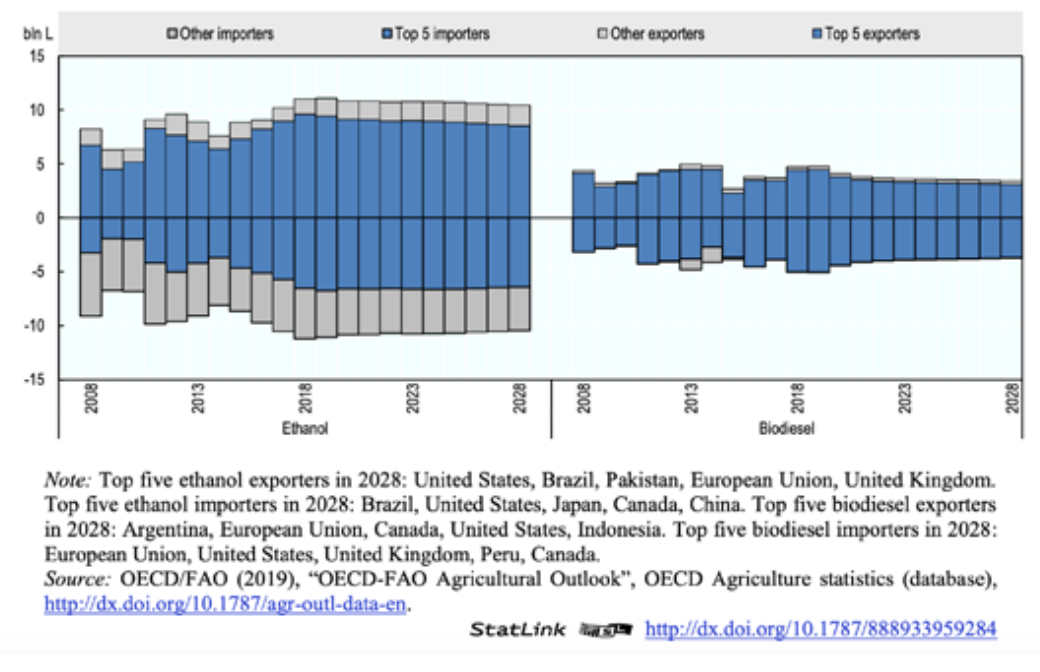
The international trade of biofuels is relatively modest and dominated by a few global players (Figure 1.3).[13] In the case of ethanol, global trade represents less than 10% of the production. The United States is a net exporter of corn-based ethanol and a modest importer of sugarcane-based ethanol. The need for sugarcane-based ethanol imports is related to the Low Carbon Fuel Standard in place in California and to the limited filling of the advanced mandate. As for biodiesel, Argentina is the lead biodiesel net exporter, followed by the European Union (mainly exports to the United Kingdom) and Canada.[14]
For the period 2019-2028, biodiesel trade is projected to decrease as most countries with biodiesel mandates or targets will fill these domestically, and imports from developed countries, in particular the United States and the European Union, are expected to decrease. Argentinian exports, however, are expected to increase, while exports from Indonesia and Malaysia should decline due primarily to diminishing export markets, notably the European Union. US ethanol exports should also decrease because of a combination of strong domestic demand and weak international demand. Brazilian ethanol exports are not expected to expand over this period given that the Brazilian ethanol industry will mostly fill sustained domestic demand and that domestic ethanol prices are expected to remain slightly above international ones.[15]
FIGURE 1.3. Outlook for Global Biofuel Trade (OECD/FAO, OECD/FAO Agricultural Outlook).
Potential Growth of Bioenergy by 2050
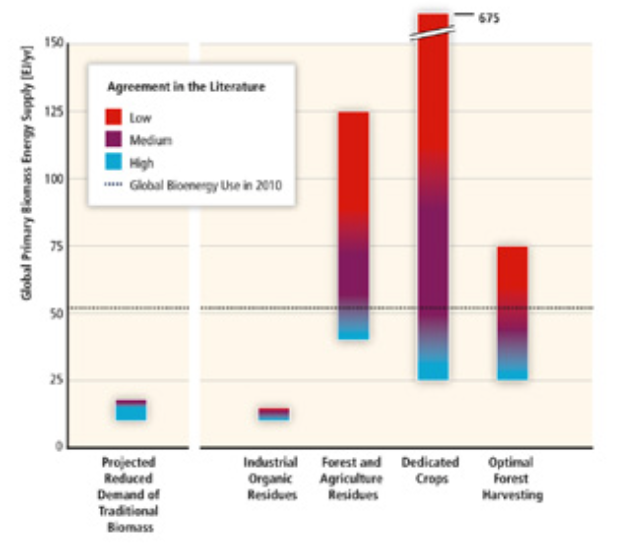
The amount of biomass for energy technically available in the future depends on the evolution of a multitude of social, political, and economic factors.[16] As there is no standard methodology to estimate the technical bioenergy potential, diverging estimates exist. Most of the recent studies estimating technical bioenergy potentials assume a 'food / fibre first principle' and exclude deforestation, eventually resulting in an estimate of the 'environmentally sustainable bioenergy potential' when a comprehensive range of environmental constraints is considered.[17] Recent estimates of global technical bioenergy potentials in 2050 span within a range of almost three orders of magnitude, from less than 50 EJ/yr to more than 1,000 EJ/yr (Figure 1.4). Most studies agree that the technical bioenergy potential in 2050 is at least approximately 100 EJ/yr with some modelling assumptions leading to estimates exceeding 500 EJ/yr.[18]
FIGURE 1.4. Global Technical Bioenergy Potential by Main Resource Category for the Year 2050 (IPCC, Climate change 2014).
Given the often-debated food versus fuel dilemma, the land requirement for food production is central for biofuels potential estimates. Projections from FAO, based on population and dietary trends, indicate a net increase in land used to grow food crops by 2050 of about 70 Mha resulting from an increase in land area under agriculture in developing countries of 130 Mha and a decrease of over 60 Mha in developed countries.[19] In terms of availability, the land available for rainfed agriculture is estimated to be 1.4 Bha of 'prime and good' land and a further 1.5 Bha of marginal land that is 'spare and usable'. Almost 1 Bha of this land is in developing countries in sub-Saharan Africa and Latin America with much of it currently under pasture/rangeland.[20]
When it comes to land demand for biofuels, observations from the 34 largest biofuel producing countries (responsible for over 90% of global production in 2010) indicated that the sharp increase in biofuel production between 2000 and 2010 led to a gross land demand of 25 Mha out of a total of 471 Mha arable land.[21] However, nearly half of the gross biofuel land area was actually associated with commercial co-products (primarily animal feeds, such as distillers dry and wet grains, soy and rape meal) which results in a net direct biofuel land demand of 13.5 Mha (i.e., 2.4% of arable land area). Additionally, it is interesting to note that the agricultural land area in those countries decreased 9 Mha over the same period, enabled by the increasing cropping intensity.[22]
Those figures suggest that, at a global level, competition with agricultural lands would not be a key constraint for the expansion of biofuels. The critical issue is hence how bioenergy production could be gracefully incorporated into human and natural systems, accounting for any negative externalities from agricultural intensification, rather than managing a competition for land between energy and food. Today, sugarcane, corn, rapeseed and soybean are the relevant feedstocks for biofuels, but many other crops and even yet undomesticated plants have the potential to play important roles as well. Lignocellulosic biomass in the form of energy crops, agricultural wastes and forest residues represents the most abundant source of renewable biomass and is widely recognized as the primary future feedstock for the biofuel and bio-based industry. But meeting future energy needs with high productivity feedstocks will require the expansion of agronomic research and breeding trials on marginal land (and possibly unsuited land for food crop production), as well as the development of cost-effective supply chains.[23]
1.5 Perspectives
The IPCC's Special Report shows that without increased and urgent mitigation ambition in the coming years, in order to have a sharp decline in GHG emissions by 2030, global warming will surpass 1.5°C in the following decades, leading to irreversible loss of the most fragile ecosystems, and crisis after crisis for the most vulnerable people and societies.
The potential and strategies to reduce energy consumption and CO2 emissions in transport differ significantly among the modes. The contribution of various measures for the CO2 emission reduction from IEA's reference scenario to the Beyond 2°C Scenario (B2DS) in 2050 can be decomposed to efficiency improvement (29%), biofuels (36%), electrification (15%), and avoid/shift (20%).[24] The total amount of biofuels consumed in the transport sector would be 24 EJ in 2060, mainly allocated to the difficult-to-decarbonize modes: HDV (heavy-duty vehicles, 35%), aviation (28%), and shipping (21%).
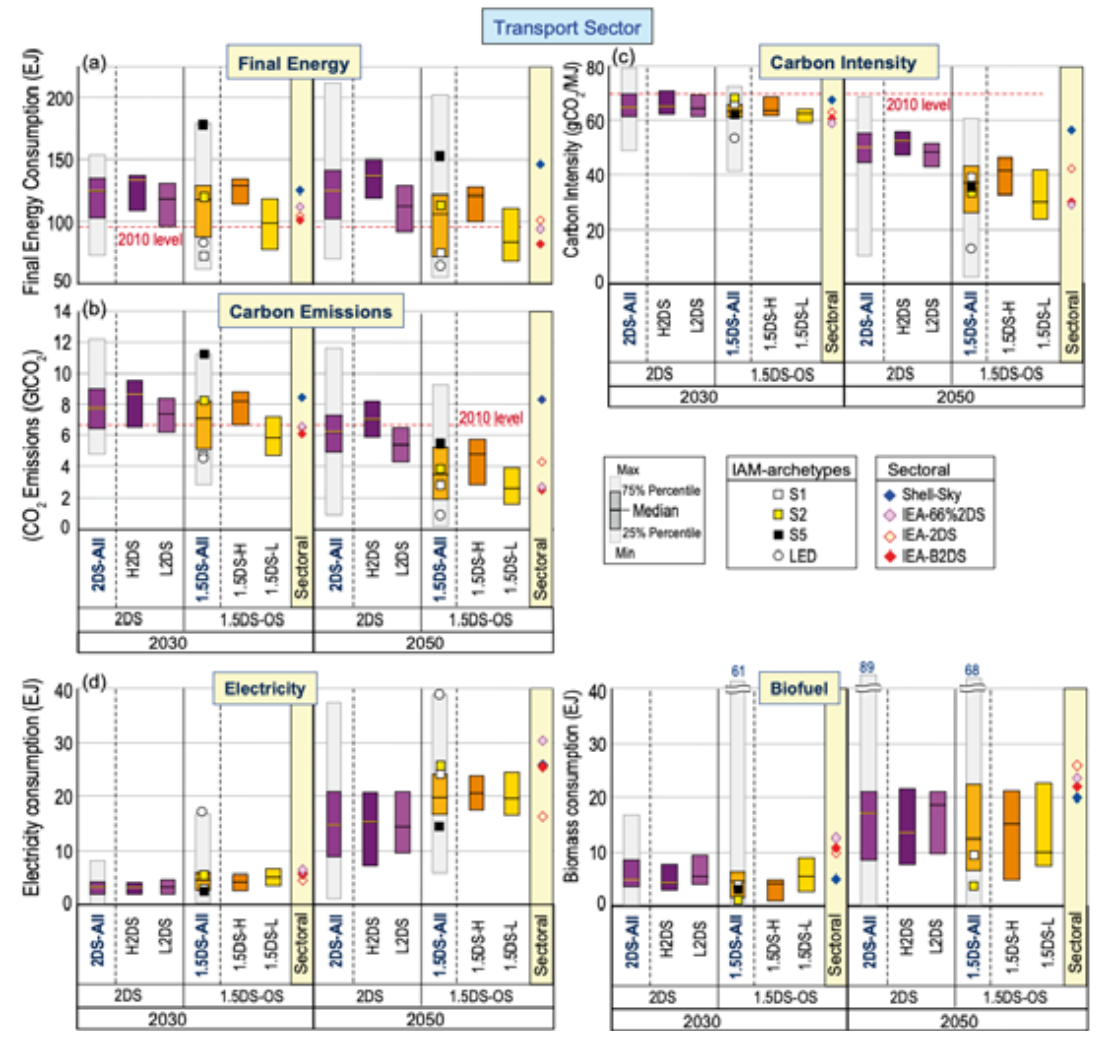
The projections of IPCC's scenarios are more pessimistic than IEA's, though both clearly project deep cuts in energy consumption and CO2 emissions by 2050 (Figure 1.5).[25] The share of low-carbon fuels in the total transport fuel mix increases to 10% and 16% by 2030 and to 40% and 58% by 2050 in 1.5°C-overshoot pathways from IPCC and the IEA, respectively.
FIGURE 1.5. Comparison of (a) Final Energy, (b) Direct CO2 Emissions, (c) Carbon Intensity, (d) Electricity and Biofuel Consumption in the Transport Sector between IPCC's and IEA's Scenarios (IPCC, Global Warming of 1.5°C.).
More recent IEA's projections estimate global biofuels demand around 10 EJ in 2040 in the Sustainable Development Scenario[26], being more than half from aviation and shipping.[27] The 2021 Net Zero by 2050 IEA report states that ""Low-emissions fuels today account for just 1% of global final energy demand, a share that increases to 20% in 2050 in the NZE. Liquid biofuels meet 14% of global transport energy demand in 2050, up from 4% in 2020; hydrogen-based fuels meet a further 28% of transport energy needs by 2050. Low-carbon gases (biomethane, synthetic methane and hydrogen) meet 35% of global demand for gas supplied through networks in 2050, up from almost zero today." However, the Covid-19 crisis has radically changed the global context for energy use. As a consequence of global lockdown measures, mobility declined at an unprecedented scale in early 2020. Road transport in regions with lockdowns in place dropped between 50% and 75%, with global average road transport activity almost falling to 50% of the 2019 level by the end of March. Global aviation activity had declined to a staggering 60%.[28]
Transport biofuel production is anticipated to contract by 13% in 2020, the first decrease in output in two decades. Due to the expected decreases in gasoline and diesel demand in 2020, IEA anticipates a contraction of 15% in ethanol output, and a 6% reduction in biodiesel and hydrotreated vegetable oil (HVO) production.
However, if transport fuel demand rebounds in 2021, biofuel production could also return to 2019 levels. Longer- term implications for growth may arise from the suspension of new policy initiatives in some countries due to low oil prices.[29]
IEA, 2019. CO2 emissions from fuel combustion 2019, Statistics. International Energy Agency, France. ↩︎
Ibid. ↩︎
IEA, 2017. Technology Roadmap - Delivering Sustainable Bioenergy. International Energy Agency, Paris, France.; IPCC, 2018. Global Warming of 1.5°C. An IPCC Special Report on the impacts of global warming of 1.5°C above pre-industrial levels and related global greenhouse gas emission pathways, in the context of strengthening the global response to the threat of climate change, sustainable development, and efforts to eradicate poverty, IPCC Special Report. Intergovernmental Panel on Climate Change. ↩︎
IEA (Ed.), 2004. Biofuels for transport: an international perspective. International Energy Agency, Paris, France. ↩︎
Ibid.; Souza, G.M., Victoria, R.L., Joly, C.A., Verdade, L.M., 2015. Bioenergy & sustainability: bridging the gaps. Scientific Committee on Problems of the Environment (SCOPE), Paris Cedex. ↩︎
IEA, Biofuels for transport. ↩︎
ICAO, 2018. Sustainable aviation fuels guide, Version 2. ed, Transforming Global Aviation Collection. ICAO, UNDP, GEF. ↩︎
IEA, 2019. World Energy Outlook 2019. OECD/IEA, Paris, France.; IEA, Technology Roadmap. ↩︎
WBA, 2019. Global Bioenergy Statistics 2019. World Bioenergy Association, Sweden. ↩︎
IEA, 2020. Transport Biofuels [WWW Document]. URL [https://www.iea.org/reports/transport-biofuels]. ↩︎
OECD/FAO. 2019. Agricultural outlook 2019-2028. Special focus: Latin America. OECD Publishing / Food and Agriculture Organization of the United Nations, Paris, France and Rome, Italy. ↩︎
Ibid. ↩︎
OECD/FAO. 2019. "OECD-FAO Agricultural Outlook". OECD Agriculture statistics (database). [http://dx.doi.org/10.1787/agr-outl-data-en]. ↩︎
OECD/FAO, Agricultural outlook 2019-2028. ↩︎
OECD/FAO, Agricultural outlook 2019-2028. ↩︎
Dornburg, V., van Vuuren, D., van de Ven, G., Langeveld, H., Meeusen, M., Banse, M., van Oorschot, M., Ros, J., Jan van den Born, G., Aiking, H., Londo, M., Mozaffarian, H., Verweij, P., Lysen, E., Faaij, A., 2010. Bioenergy revisited: Key factors in global potentials of bioenergy. Energy Environ. Sci. 3, 258. [https://doi]. [org/10.1039/b922422]j. ↩︎
Batidzirai, B., Smeets, E.M.W., Faaij, A.P.C., 2012. Harmonising bioenergy resource potentials---Methodological lessons from review of state of the art bioenergy potential assessments. Renewable and Sustainable Energy Reviews 16, 6598--6630. [https://doi.org/10.1016/j.rser.2012.09.002]; IPCC (Ed.), 2014. Climate change 2014: mitigation of climate change: Working Group III contribution to the Fifth Assessment Report of the Intergovernmental Panel on Climate Change. Cambridge University Press, New York, NY. ↩︎
IPCC, Climate change 2014. ↩︎
Alexandratos, N., Bruinsma, J., 2012. World agriculture towards 2030/2050: the 2012 revision (No. 12-- 03), ESA Working Paper. FAO Agricultural Development Economics Division, Rome. ↩︎
Souza et al., Bioenergy & sustainability: bridging the gaps. ↩︎
Langeveld, H., Dixon, J., Keulen, H. van (Eds.), 2014. Biofuel cropping systems: carbon, land, and food, First edition. ed. Routledge, Abingdon, Oxon. ↩︎
Woods, J., Lynd, L.R., Laser, M., Batistella, M., Victoria, D. de C., Kline, K., Faaij, A., 2015. Land and Bioenergy, in: Bioenergy & Sustainability: Bridging the Gaps. Scientific Committee on Problems of the Environment (SCOPE), Paris Cedex, pp. 258--301. ↩︎
Souza et al., Bioenergy & sustainability. ↩︎
The Beyond 2°C Scenario (B2DS) explores the feasibility of accelerating clean energy technology deployment in pursuit of more ambitious climate goals. The B2DS has the potential to approach carbon neutrality by 2060 and limit temperature increases to 1.75°C by 2100.; IEA, Technology Roadmap. ↩︎
IPCC, Global Warming of 1.5°C. ↩︎
The Sustainable Development Scenario maps out a way to meet sustainable energy goals in full, requiring rapid and widespread changes across all parts of the energy system. This scenario charts a path fully aligned with the Paris Agreement by holding the rise in global temperatures to "well below 2°C ... and pursuing efforts to limit [it] to 1.5°C", and meets objectives related to universal energy access and cleaner air (IEA, World Energy Outlook 2019). ↩︎
IEA, World Energy Outlook 2019. ↩︎
IEA. 2020. Global Energy Review 2020 - The impacts of the Covid-19 crisis on global energy demand and CO2 emissions. International Energy Agency, Paris. ↩︎
IEA. 2020. "Renewable Energy Market Update". Fuel Report. Paris: International Energy Agency. [https://www.iea.org/reports/renewable-energy-market-] [update]. ↩︎